6.9 KiB
Cached queries guidelines
Rails provides an SQL query cache, used to cache the results of database queries for the duration of the request.
If Rails encounters the same query again for that request, it will use the cached result set as opposed to running the query against the database again.
The query results are only cached for the duration of that single request, it does not persist across multiple requests.
Why cached queries are considered bad
The cached queries help with reducing DB load, but they still:
- Consume memory.
- Require as to re-instantiate each
ActiveRecordobject. - Require as to re-instantiate each relation of the object.
- Make us spend additional CPU-cycles to look into a list of cached queries.
The Cached SQL queries are cheaper, but they are not cheap at all from memory perspective.
They could mask N+1 query problem,
so we should threat them the same way we threat regular N+1 queries.
In case of N+1 queries, masked with cached queries, we are executing the same query N times. It will not hit the database N times, it will return the cached results instead. This is still expensive since we need to re-initialize objects each time, and this is CPU/Memory expensive. Instead, we should use the same in-memory objects, if possible.
When we introduce a new feature, we should avoid N+1 problems, minimize the query count, and pay special attention that cached queries are not masking N+1 problems.
How to detect
Detect potential offenders by using Kibana
On GitLab.com, we are logging entries with the number of executed cached queries in the
pubsub-redis-inf-gprd* index with the db_cached_count.
We can filter endpoints that have a large number of executed cached queries. For example, if we encounter an endpoint
that has 100+ db_cached_count, this could indicate that there is an N+1 problem masked with cached queries.
We should probably investigate this endpoint further, to check if we are executing duplicated cached queries.
For more cached queries Kibana visualizations see this issue.
Inspect suspicious endpoint using Performance Bar
When building features, you could use the performance bar to list database queries, which will include cached queries as well. The performance bar will show a warning when threshold of total executed queries (including cached ones) has exceeded 100 queries.
What to look for
Using Kibana, you can look for a large number
of executed cached queries. End-points with large number of db_cached_count could indicate that there
are probably a lot of duplicated cached queries, which often indicates a masked N+1 problem.
When you investigate specific endpoint, you could use the performance bar. If you see a lot of similar queries, this often indicates an N+1 query issue (or a similar kind of query batching problem). If you see same cached query executed multiple times, this often indicates a masked N+1 query problem.
For example, let's say you wanted to debug GroupMembers page.
In the left corner of the performance bar you could see Database queries showing the total number of database queries and the number of executed cached queries:

We can see that there are 55 cached queries. By clicking on the number, a modal window with more details is shown.
Cached queries are marked with the cached label, so they are easy to spot. We can see that there are multiple duplicated
cached queries:
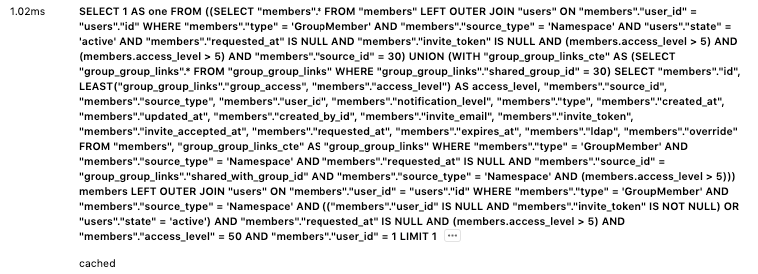
If we click on ... for one of them, it will expand the actual stack trace:
[
  "app/models/group.rb:305:in `has_owner?'",
  "ee/app/views/shared/members/ee/_license_badge.html.haml:1",
  "app/helpers/application_helper.rb:19:in `render_if_exists'",
  "app/views/shared/members/_member.html.haml:31",
  "app/views/groups/group_members/index.html.haml:75",
  "app/controllers/application_controller.rb:134:in `render'",
  "ee/lib/gitlab/ip_address_state.rb:10:in `with'",
  "ee/app/controllers/ee/application_controller.rb:44:in `set_current_ip_address'",
  "app/controllers/application_controller.rb:493:in `set_current_admin'",
  "lib/gitlab/session.rb:11:in `with_session'",
  "app/controllers/application_controller.rb:484:in `set_session_storage'",
  "app/controllers/application_controller.rb:478:in `set_locale'",
  "lib/gitlab/error_tracking.rb:52:in `with_context'",
  "app/controllers/application_controller.rb:543:in `sentry_context'",
  "app/controllers/application_controller.rb:471:in `block in set_current_context'",
  "lib/gitlab/application_context.rb:54:in `block in use'",
  "lib/gitlab/application_context.rb:54:in `use'",
  "lib/gitlab/application_context.rb:21:in `with_context'",
  "app/controllers/application_controller.rb:463:in `set_current_context'",
  "lib/gitlab/jira/middleware.rb:19:in `call'"
]
The stack trace, shows us that we obviously have an N+1 problem, since we are repeatably executing for each group member:
group.has_owner?(current_user)
This is easily solvable by extracting this check, above the loop.
After the fix, we now have:

How to measure the impact of the change
We can use the memory profiler to profile our code.
For the previous example, we could wrap the profiler around the Groups::GroupMembersController#index action.
We had:
- Total allocated: 7133601 bytes (84858 objects)
- Total retained: 757595 bytes (6070 objects)
db_count: 144db_cached_count: 55db_duration: 303ms
After the fix, we can see that we have reduced the allocated memory as well as the number of cached queries and improved execution time:
- Total allocated: 5313899 bytes (65290 objects), 1810KB (25%) less
- Total retained: 685593 bytes (5278 objects), 72KB (9%) less
db_count: 95 (34% less)db_cached_count: 6 (89% less)db_duration: 162ms (87% faster)