7.8 KiB
Distributed Tracing - development guidelines
GitLab is instrumented for distributed tracing.
According to Open Tracing:
Distributed tracing, also called distributed request tracing, is a method used to profile and monitor applications, especially those built using a microservices architecture. Distributed tracing helps to pinpoint where failures occur and what causes poor performance.
Distributed tracing is especially helpful in understanding the lifecycle of a request as it passes through the different components of the GitLab application. At present, Workhorse, Rails, Sidekiq, and Gitaly support tracing instrumentation.
Distributed tracing adds minimal overhead when disabled, but imposes only small overhead when enabled and is therefore capable in any environment, including production. For this reason, it can be useful in diagnosing production issues, particularly performance problems.
Enabling distributed tracing
GitLab uses the GITLAB_TRACING environment variable to configure distributed tracing. The same
configuration is used for all components (e.g., Workhorse, Rails, etc).
When GITLAB_TRACING is not set, the application will not be instrumented, meaning that there is
no overhead at all.
To enable GITLAB_TRACING, a valid "configuration-string" value should be set, with a URL-like
form:
GITLAB_TRACING=opentracing://<driver>?<param_name>=<param_value>&<param_name_2>=<param_value_2>
In this example, we have the following hypothetical values:
driver: the driver. GitLab supportsjaeger. In future, other tracing implementations may also be supported.param_name,param_value: these are driver specific configuration values. Configuration parameters for Jaeger are documented further on in this document they should be URL encoded. Multiple values should be separated by&characters like a URL.
Using Jaeger in the GitLab Development Kit
The first tracing implementation that GitLab supports is Jaeger, and the GitLab Development Kit supports distributed tracing with Jaeger out-of-the-box.
The easiest way to access tracing from a GDK environment is through the
performance-bar. This can be shown
by typing p b in the browser window.
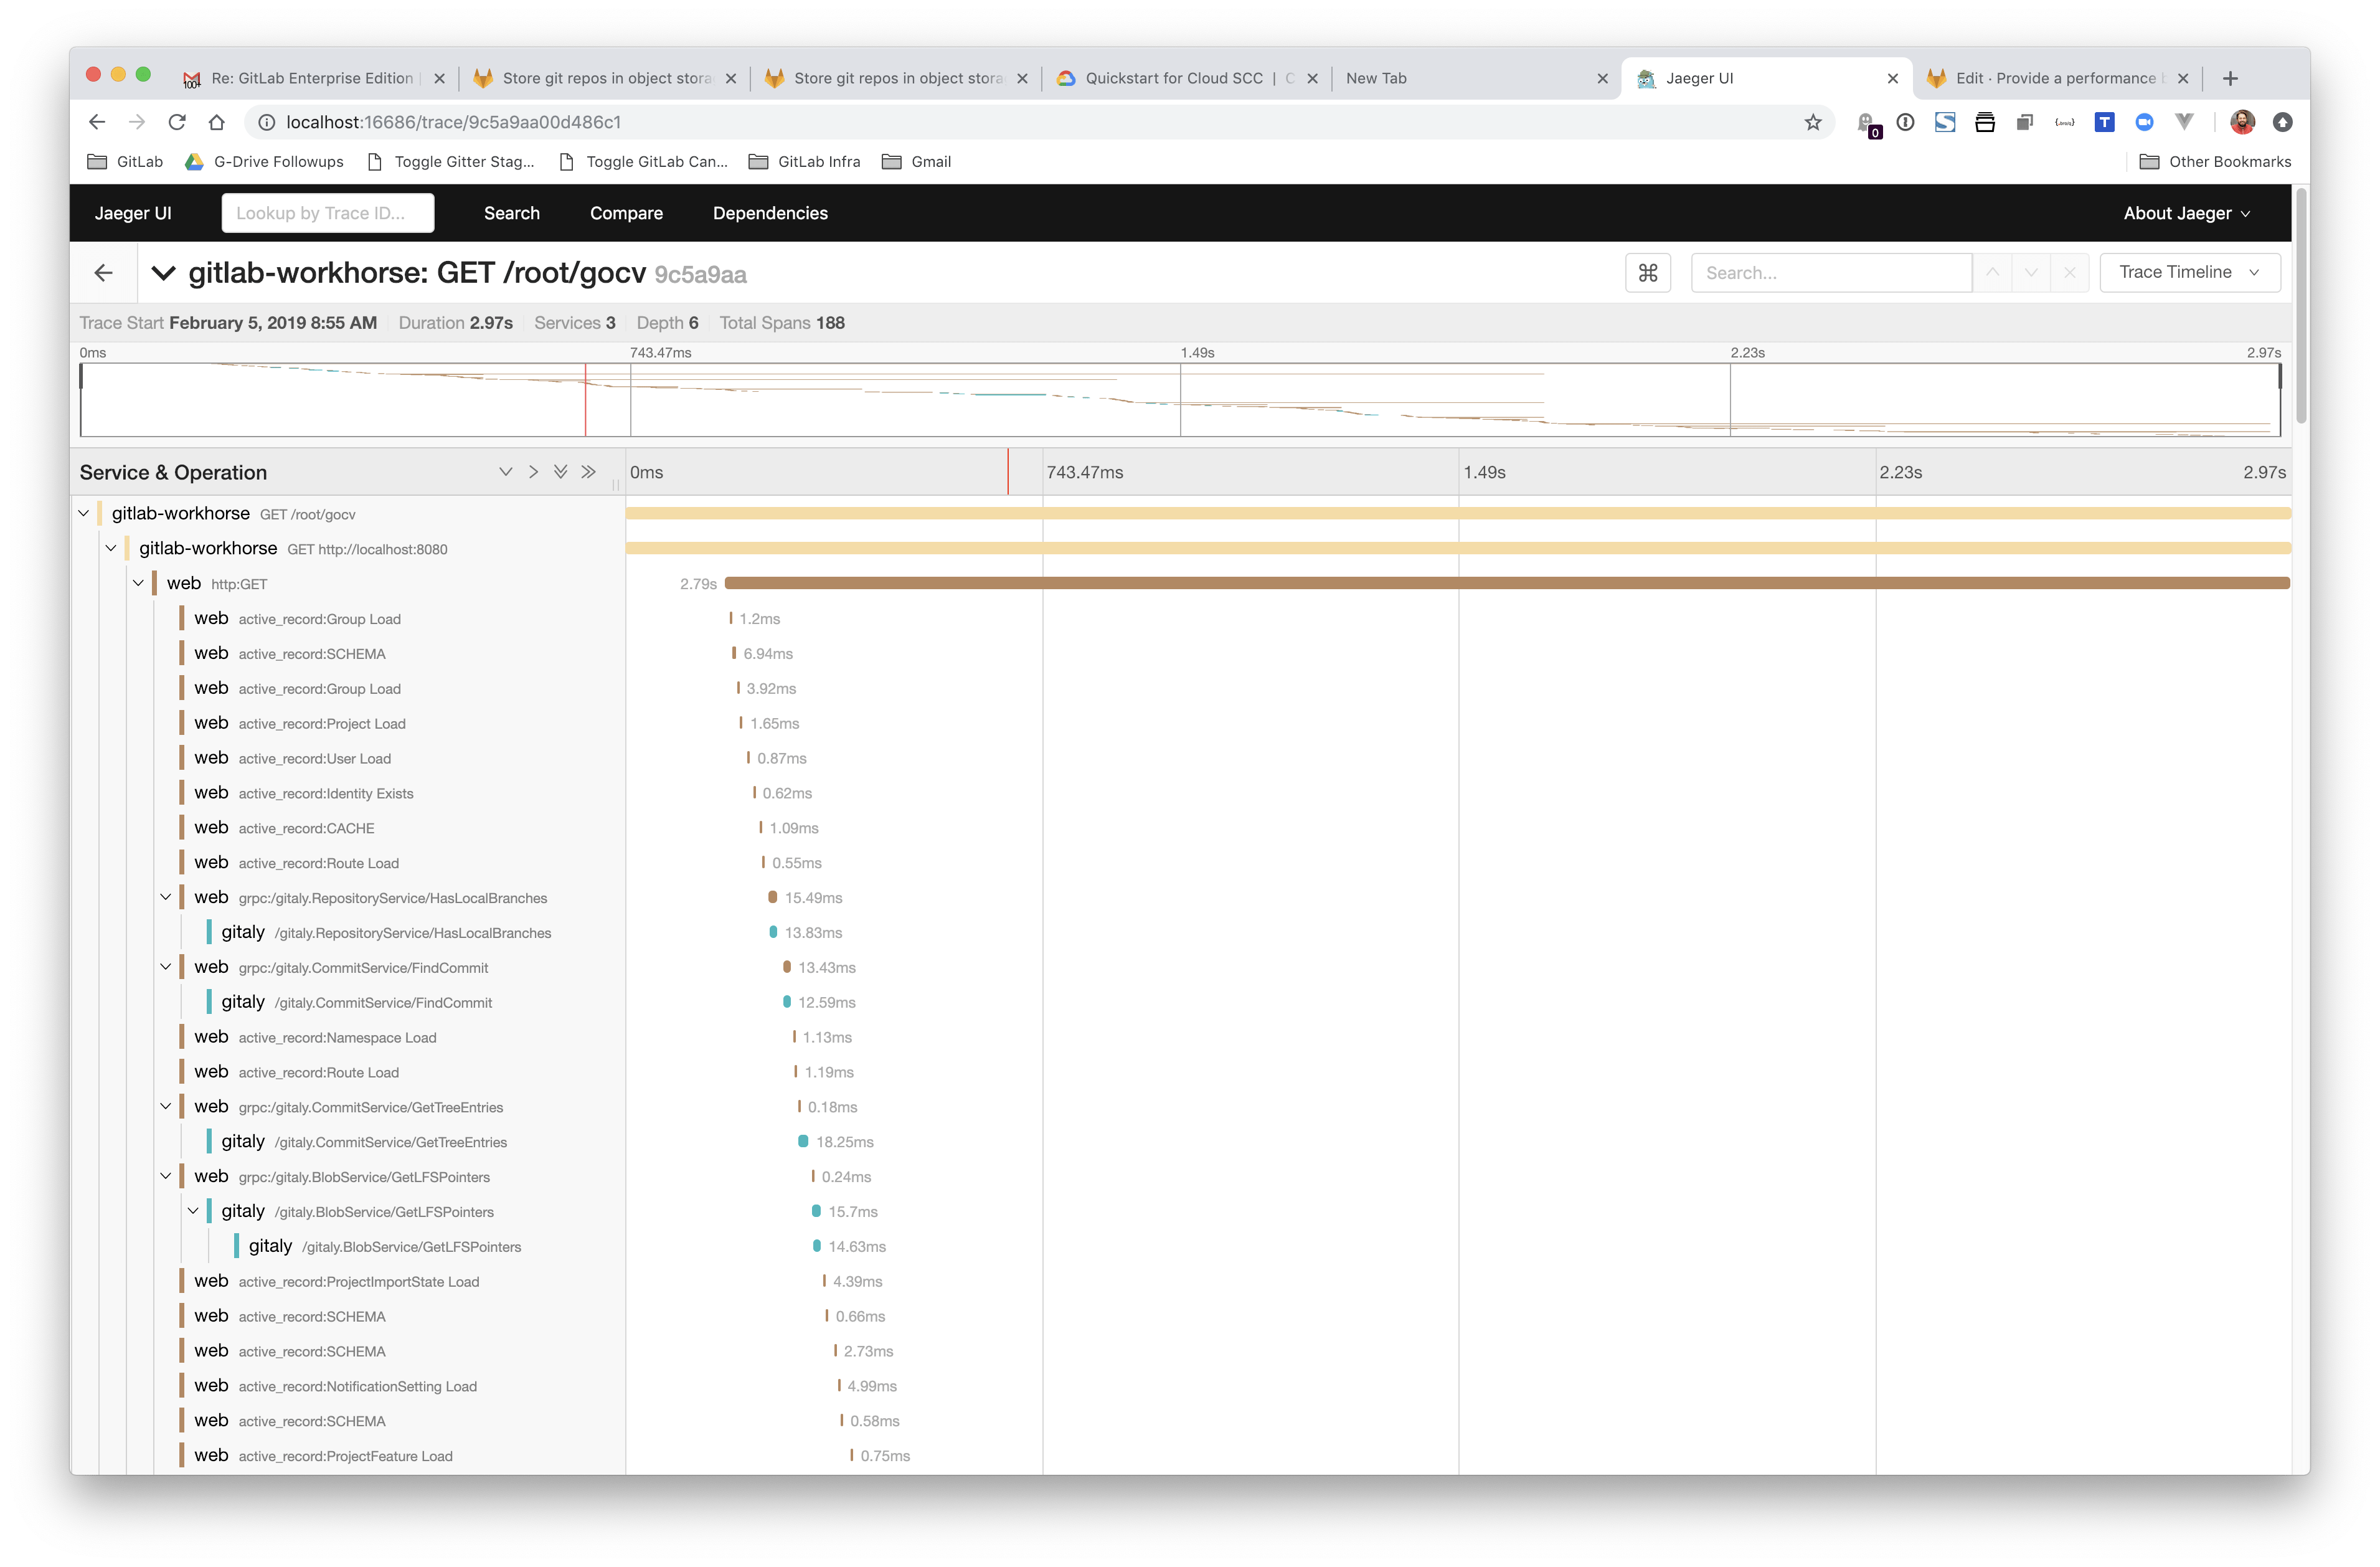
Once the performance bar is enabled, click on the Trace link in the performance bar to go to the Jaeger UI.
The Jaeger search UI will return a query for the Correlation-ID of the current request. Normally,
this search should return a single trace result. Clicking this result will show the detail of the
trace in a hierarchical time-line.
Using Jaeger without the GitLab Developer Kit
Distributed Tracing can be enabled in non-GDK development environments as well as production or staging environments, for troubleshooting. Please note that at this time, this functionality is experimental, and not supported in production environments at present. In this first release, it is intended to be used for debugging in development environments only.
Jaeger tracing can be enabled through a three-step process:
- Start Jaeger.
- Configure the
GITLAB_TRACINGenvironment variable. - Start the GitLab application.
- Go to the Jaeger Search UI in your browser.
1. Start Jaeger
Jaeger has many configuration options, but is very easy to start in an "all-in-one" mode which uses memory for trace storage (and is therefore non-persistent). The main advantage of "all-in-one" mode being ease of use.
For more detailed configuration options, refer to the Jaeger documentation.
Using Docker
If you have Docker available, the easier approach to running the Jaeger all-in-one is through Docker, using the following command:
$ docker run \
  --rm \
  -e COLLECTOR_ZIPKIN_HTTP_PORT=9411  \
  -p 5775:5775/udp \
  -p 6831:6831/udp \
  -p 6832:6832/udp \
  -p 5778:5778 \
  -p 16686:16686 \
  -p 14268:14268 \
  -p 9411:9411 \
  jaegertracing/all-in-one:latest
Using the Jaeger process
Without Docker, the all-in-one process is still easy to setup.
- Download the latest Jaeger release for your platform.
- Extract the archive and run the
bin/all-in-oneprocess.
This should start the process with the default listening ports.
2. Configure the GITLAB_TRACING environment variable
Once you have Jaeger running, you'll need to configure the GITLAB_TRACING variable with the
appropriate configuration string.
TL;DR: If you are running everything on the same host, use the following value:
export GITLAB_TRACING="opentracing://jaeger?http_endpoint=http%3A%2F%2Flocalhost%3A14268%2Fapi%2Ftraces&sampler=const&sampler_param=1"
This configuration string uses the Jaeger driver opentracing://jaeger with the following options:
| Name | Value | Description |
|---|---|---|
http_endpoint |
http://localhost:14268/api/traces |
Configures Jaeger to send trace information to the HTTP endpoint running on http://localhost:14268/. Alternatively, the upd_endpoint can be used. |
sampler |
const |
Configures Jaeger to use the constant sampler (either on or off). |
sampler_param |
1 |
Configures the const sampler to sample all traces. Using 0 would sample no traces. |
Other parameter values are also possible:
| Name | Example | Description |
|---|---|---|
udp_endpoint |
localhost:6831 |
This is the default. Configures Jaeger to send trace information to the UDP listener on port 6831 using compact thrift protocol. Note that we've experienced some issues with the Jaeger Client for Ruby when using this protocol. |
sampler |
probabalistic |
Configures Jaeger to use a probabilistic random sampler. The rate of samples is configured by the sampler_param value. |
sampler_param |
0.01 |
Use a ratio of 0.01 to configure the probabalistic sampler to randomly sample 1% of traces. |
NOTE: Note:
The same GITLAB_TRACING value should to be configured in the environment
variables for all GitLab processes, including Workhorse, Gitaly, Rails, and Sidekiq.
3. Start the GitLab application
Once the GITLAB_TRACING environment variable is exported to all GitLab services, start the
application.
When GITLAB_TRACING is configured properly, the application will log this on startup:
13:41:53 gitlab-workhorse.1      | 2019/02/12 13:41:53 Tracing enabled
...
13:41:54 gitaly.1                | 2019/02/12 13:41:54 Tracing enabled
...
If GITLAB_TRACING is not configured correctly, this will also be logged:
13:43:45 gitaly.1 | 2019/02/12 13:43:45 skipping tracing configuration step: tracer: unable to load driver mytracer
By default, GitLab ships with the Jaeger tracer, but other tracers can be included at compile time. Details of how this can be done are included in the LabKit tracing documentation.
If no log messages about tracing are emitted, the GITLAB_TRACING environment variable is likely
not set.
4. Open the Jaeger Search UI
By default, the Jaeger search UI is available at http://localhost:16686/search.
TIP: Tip: Don't forget that you will need to generate traces by using the application before they appear in the Jaeger UI.

