1.6 KiB
1.6 KiB
| stage | group | info |
|---|---|---|
| Manage | Optimize | To determine the technical writer assigned to the Stage/Group associated with this page, see https://about.gitlab.com/handbook/engineering/ux/technical-writing/#assignments |
Repository Analytics (FREE)
Get high-level overview of the project's Git repository.
Availability
Repository Analytics is part of GitLab Community Edition. It's available to anyone who has permission to clone the repository.
The feature requires:
- An initialized Git repository.
- At least one commit in the default branch (
masterby default).
Overview
You can find Repository Analytics in the project's sidebar. To access the page, go to {chart} Analytics > Repository.
NOTE: Without a Git commit in the default branch, the menu item won't be visible. Commits in a project's wiki are not included in the analysis.
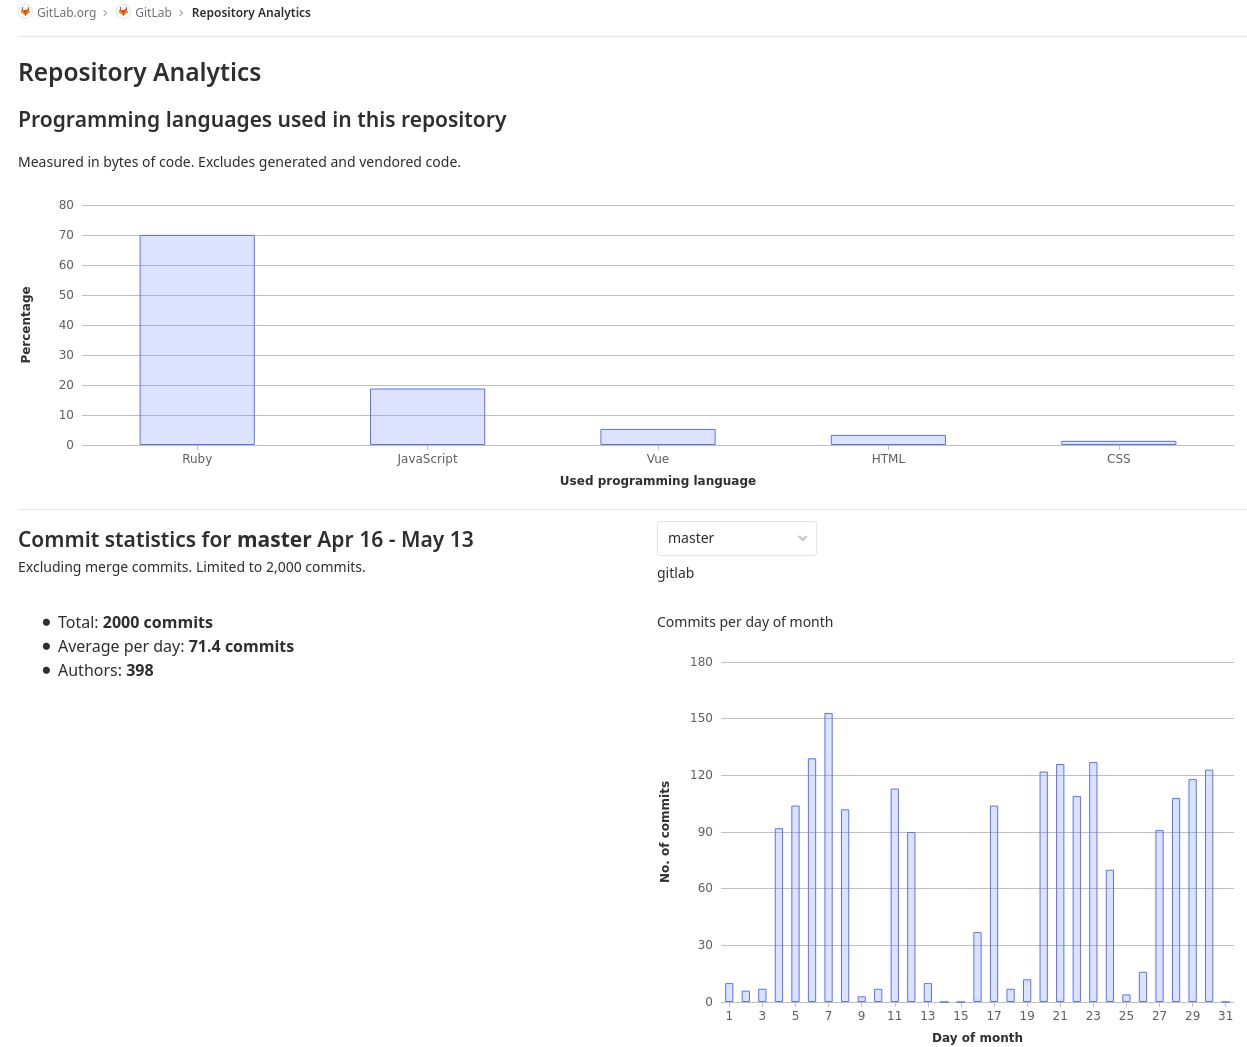
Charts
The data in the charts are queued. Background workers update the charts 10 minutes after each commit in the default branch. Depending on the size of the GitLab installation, it may take longer for data to refresh due to variations in the size of background job queues.
Available charts:
- Programming languages used in the repository
- Code coverage history (last 3 months) (Introduced in GitLab 13.1)
- Commit statistics (last month)
- Commits per day of month
- Commits per weekday
- Commits per day hour (UTC)