5.1 KiB
| stage | group | info |
|---|---|---|
| Monitor | APM | To determine the technical writer assigned to the Stage/Group associated with this page, see https://about.gitlab.com/handbook/engineering/ux/technical-writing/#designated-technical-writers |
Grafana Configuration
Grafana is a tool that allows you to visualize time series metrics through graphs and dashboards. GitLab writes performance data to Prometheus and Grafana will allow you to query to display useful graphs.
Installation
Omnibus GitLab can help you install Grafana (recommended) or Grafana supplies package repositories (Yum/Apt) for easy installation. See Grafana installation documentation for detailed steps.
NOTE: Note:
Before starting Grafana for the first time, set the admin user
and password in /etc/grafana/grafana.ini. Otherwise, the default password
will be admin.
Configuration
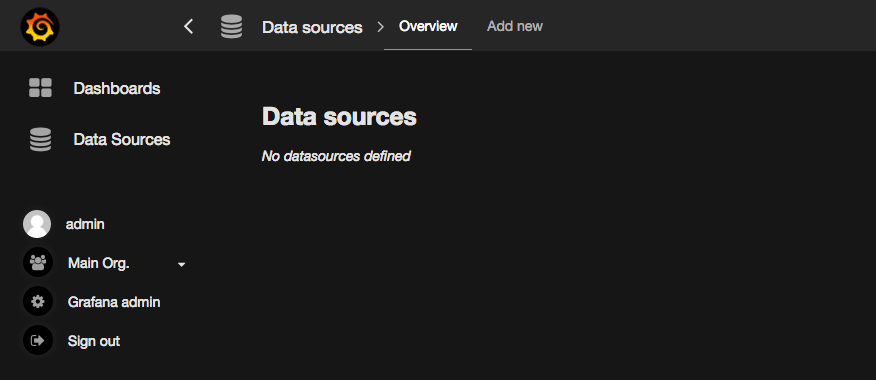
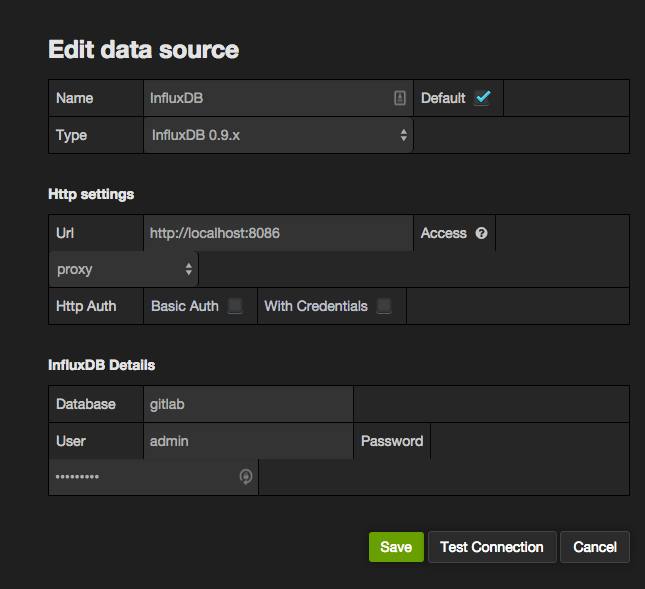
Login as the admin user. Expand the menu by clicking the Grafana logo in the top left corner. Choose 'Data Sources' from the menu. Then, click 'Add new' in the top bar.
Import Dashboards
You can now import a set of default dashboards that will give you a good start on displaying useful information. GitLab has published a set of default Grafana dashboards to get you started. Clone the repository or download a zip/tarball, then follow these steps to import each JSON file.
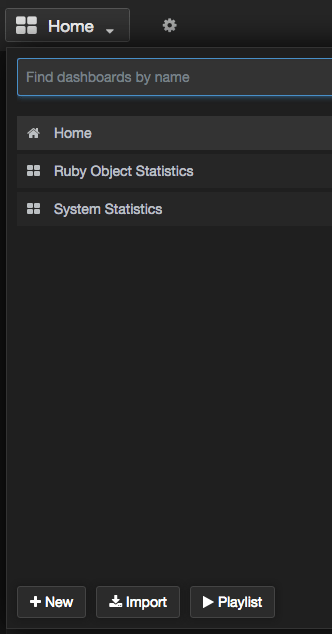
Open the dashboard dropdown menu and click 'Import'
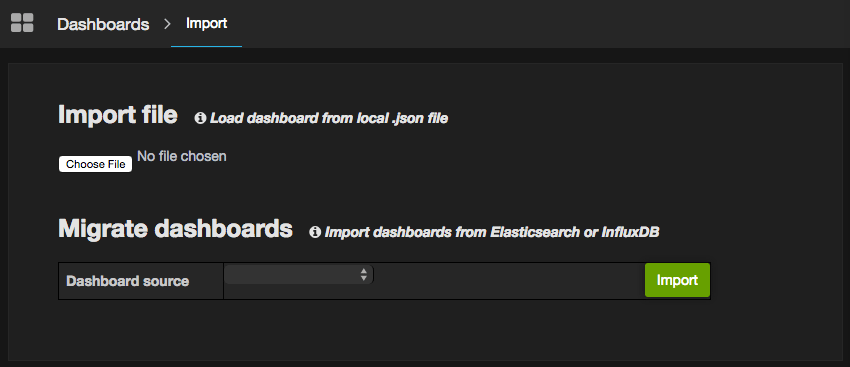
Click 'Choose file' and browse to the location where you downloaded or cloned the dashboard repository. Pick one of the JSON files to import.
Once the dashboard is imported, be sure to click save icon in the top bar. If you do not save the dashboard after importing it will be removed when you navigate away.
![]()
Repeat this process for each dashboard you wish to import.
Alternatively you can automatically import all the dashboards into your Grafana instance. See the README of the Grafana dashboards repository for more information on this process.
Integration with GitLab UI
Introduced in GitLab 12.1.
If you have set up Grafana, you can enable a link to access it easily from the sidebar:
-
Go to the Admin Area > Settings > Metrics and profiling.
-
Expand Metrics - Grafana.
-
Check the "Enable access to Grafana" checkbox.
-
If Grafana is enabled through Omnibus GitLab and on the same server, leave Grafana URL unchanged. It should be
/-/grafana.In any other case, enter the full URL of the Grafana instance.
-
Click Save changes.
-
The new link will be available in the Admin Area > Monitoring > Metrics Dashboard.
Security Update
Users running GitLab version 12.0 or later should immediately upgrade to one of the following security releases due to a known vulnerability with the embedded Grafana dashboard:
- 12.0.6
- 12.1.6
After upgrading, the Grafana dashboard will be disabled and the location of your existing Grafana data will be changed from /var/opt/gitlab/grafana/data/ to /var/opt/gitlab/grafana/data.bak.#{Date.today}/.
To prevent the data from being relocated, you can run the following command prior to upgrading:
echo "0" > /var/opt/gitlab/grafana/CVE_reset_status
To reinstate your old data, move it back into its original location:
sudo mv /var/opt/gitlab/grafana/data.bak.xxxx/ /var/opt/gitlab/grafana/data/
However, you should not reinstate your old data except under one of the following conditions:
- If you are certain that you changed your default admin password when you enabled Grafana
- If you run GitLab in a private network, accessed only by trusted users, and your Grafana login page has not been exposed to the internet
If you require access to your old Grafana data but do not meet one of these criteria, you may consider:
- Reinstating it temporarily.
- Exporting the dashboards you need.
- Refreshing the data and re-importing your dashboards.
DANGER: Danger: This poses a temporary vulnerability while your old Grafana data is in use and the decision to do so should be weighed carefully with your need to access existing data and dashboards.
For more information and further mitigation details, please refer to our blog post on the security release.
Read more on: