7.3 KiB
| stage | group | info |
|---|---|---|
| Monitor | APM | To determine the technical writer assigned to the Stage/Group associated with this page, see https://about.gitlab.com/handbook/engineering/ux/technical-writing/#designated-technical-writers |
Monitor metrics for your CI/CD environment
After configuring Prometheus for a cluster, GitLab attempts to retrieve performance metrics for any environment with a successful deployment.
GitLab scans the Prometheus server for metrics from known servers like Kubernetes and NGINX, and attempts to identify individual environments. To learn more about the supported metrics and scan processes, see the Prometheus Metrics Library documentation.
To view the metrics dashboard for an environment that has completed at least one deployment:
- If the metrics dashboard is only visible to project members, sign in to GitLab as a member of a project. Learn more about metrics dashboard visibility.
- In your project, navigate to {cloud-gear} Operations > Metrics.
GitLab displays the default metrics dashboard for the environment, like the following example:
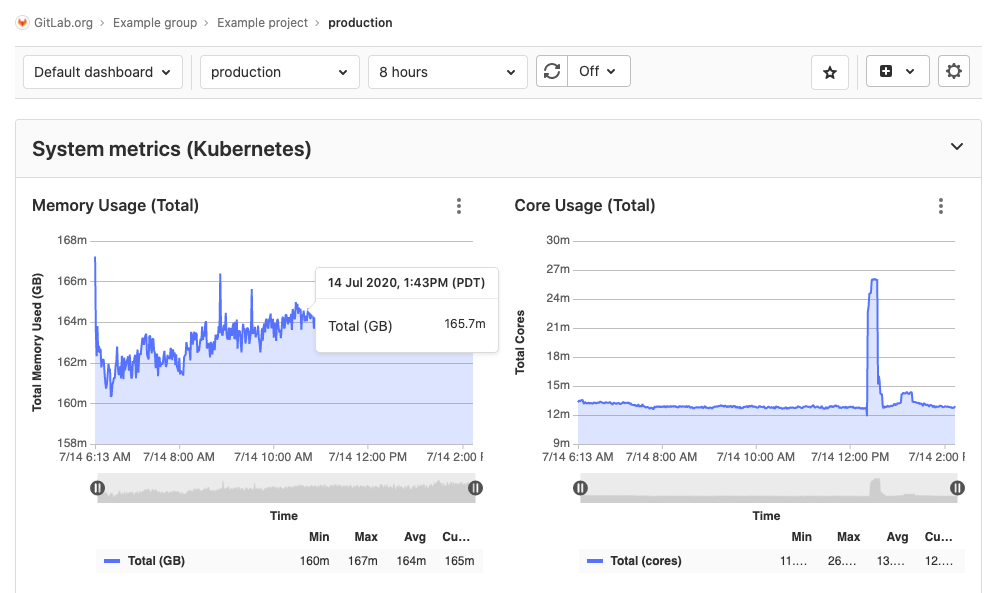
The top of the dashboard contains a navigation bar. From left to right, the navigation bar contains:
- Dashboard - A dropdown list of all dashboards available for the project, with starred dashboards listed first.
- Environment - A dropdown list of all environments that searches through all environments as you type.
- Range - The time period of data to display.
- Refresh dashboard {retry} - Reload the dashboard with current data.
- Set refresh rate - Set a time frame for refreshing the data displayed.
- Star dashboard {star-o} - Click to mark a dashboard as a favorite. Starred dashboards display a solid star {star} button, and display first in the Dashboard dropdown list. (Introduced in GitLab 13.0.)
- Create dashboard {file-addition-solid} - Create a new custom dashboard for your project.
- Metrics settings {settings} - Configure the settings for this dashboard.
Populate your metrics dashboard
After configuring Prometheus for a cluster, you must also deploy code for the {cloud-gear} Operations > Metrics page to contain data. Setting up Auto DevOps helps quickly create a deployment:
- Navigate to your project's {cloud-gear} Operations > Kubernetes page.
- Ensure that, in addition to Prometheus, you also have Runner and Ingress installed.
- After installing Ingress, copy its endpoint.
- Navigate to your project's {settings} Settings > CI/CD page. In the Auto DevOps section, select a deployment strategy and save your changes.
- On the same page, in the Variables section, add a variable named
KUBE_INGRESS_BASE_DOMAINwith the value of the Ingress endpoint you copied previously. Leave the type as Variable. - Navigate to your project's {rocket} CI/CD > Pipelines page, and run a pipeline on any branch.
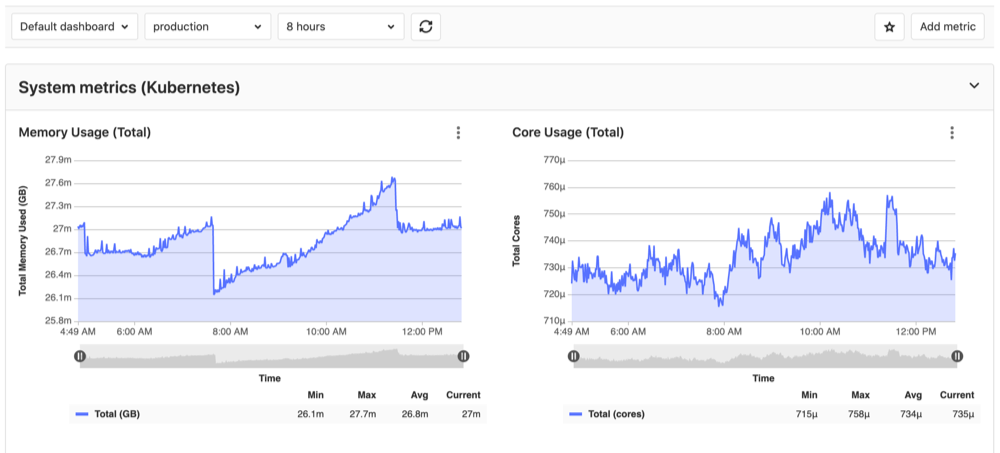
- When the pipeline has run successfully, graphs are available on the {cloud-gear} Operations > Metrics page.
Customize your metrics dashboard
After creating your dashboard, you can customize it to meet your needs:
- Add custom metrics: In addition to the GitLab default metrics, you can create custom metrics and display them on your metrics dashboard.
- Configure alerts for metrics: Configure custom alerts for your team when environment performance falls outside of the boundaries you set.
- Trigger actions from alerts: Open new issues for your team (ULTIMATE) when environment performance falls outside of the boundaries you set.
Metrics dashboard visibility
Introduced in GitLab 13.0.
You can set the visibility of the metrics dashboard to Only Project Members or Everyone With Access. When set to Everyone with Access, the metrics dashboard is visible to authenticated and non-authenticated users.
Adding custom metrics
- Introduced in GitLab Premium 10.6.
- Moved to GitLab Core 12.10.
Custom metrics can be monitored by adding them on the monitoring dashboard page. After saving them, they display on the environment metrics dashboard provided that either:
- A connected Kubernetes cluster with the matching environment scope is used and Prometheus installed on the cluster.
- Prometheus is manually configured.
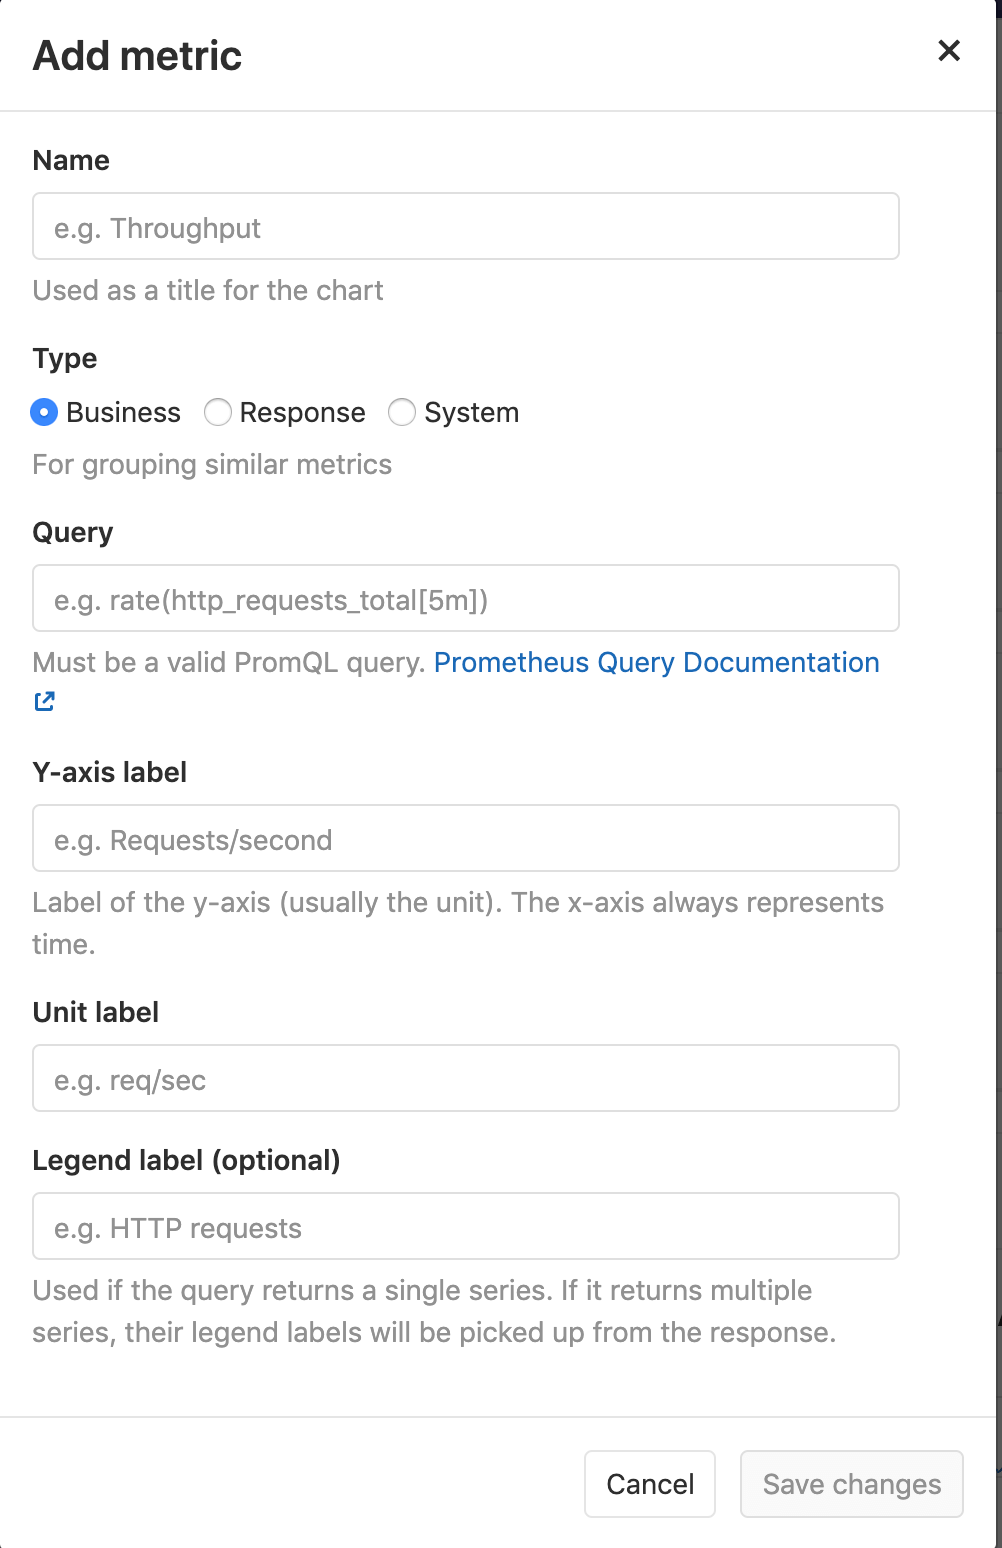
A few fields are required:
- Name: Chart title
- Type: Type of metric. Metrics of the same type will be shown together.
- Query: Valid PromQL query.
- Y-axis label: Y axis title to display on the dashboard.
- Unit label: Query units, for example
req / sec. Shown next to the value.
Multiple metrics can be displayed on the same chart if the fields Name, Type,
and Y-axis label match between metrics. For example, a metric with Name
Requests Rate, Type Business, and Y-axis label rec / sec would display
on the same chart as a second metric with the same values. A Legend label is
suggested if this feature is used.
Editing additional metrics from the dashboard
Introduced in GitLab 12.9.
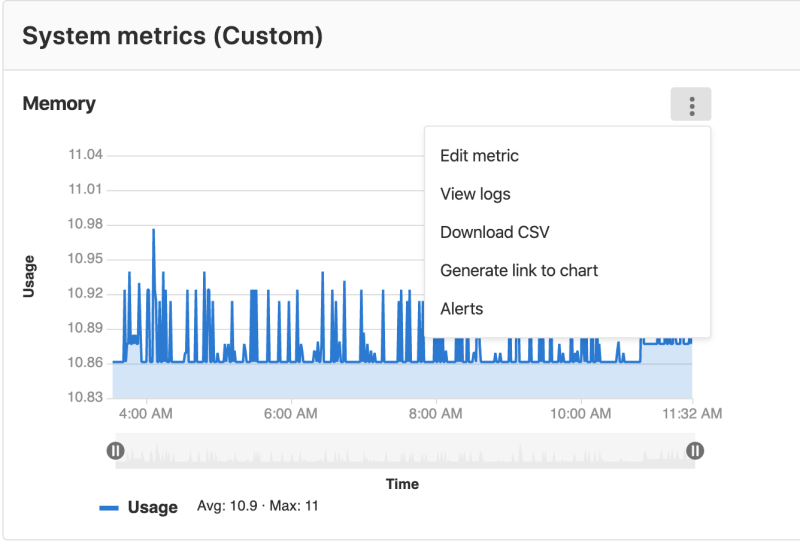
You can edit existing additional custom metrics for your dashboard by clicking the {ellipsis_v} More actions dropdown and selecting Edit metric.
Keyboard shortcuts for charts
Introduced in GitLab 13.2.
You can use keyboard shortcuts to interact more quickly with your currently-focused chart panel. To activate keyboard shortcuts, use keyboard tabs to highlight the {ellipsis_v} More actions dropdown menu, or hover over the dropdown menu with your mouse, then press the key corresponding to your desired action:
- Expand panel - e
- View logs - l (lowercase 'L')
- Download CSV - d
- Copy link to chart - c
- Alerts - a