4.2 KiB
| stage | group | info |
|---|---|---|
| Monitor | APM | To determine the technical writer assigned to the Stage/Group associated with this page, see https://about.gitlab.com/handbook/engineering/ux/technical-writing/#designated-technical-writers |
Embedding Grafana charts
Grafana metrics can be embedded in GitLab Flavored Markdown.
Embedding charts via Grafana Rendered Images
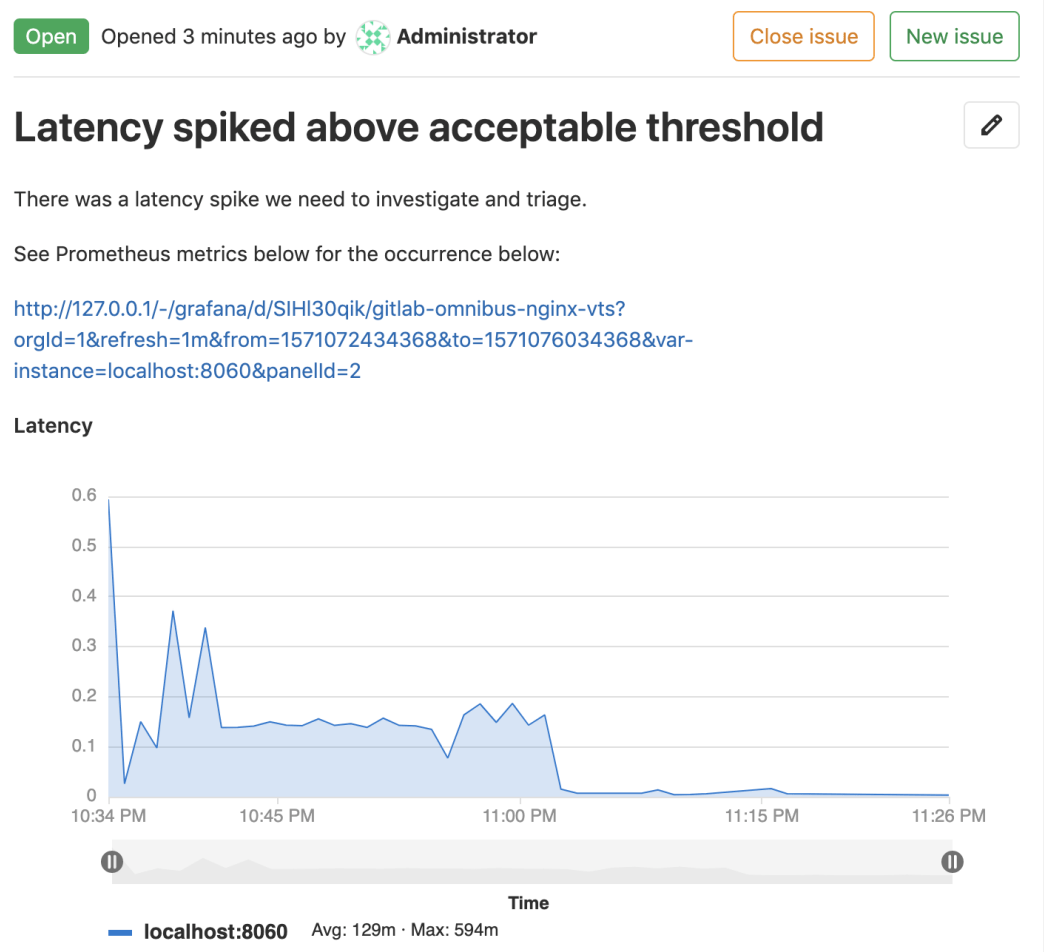
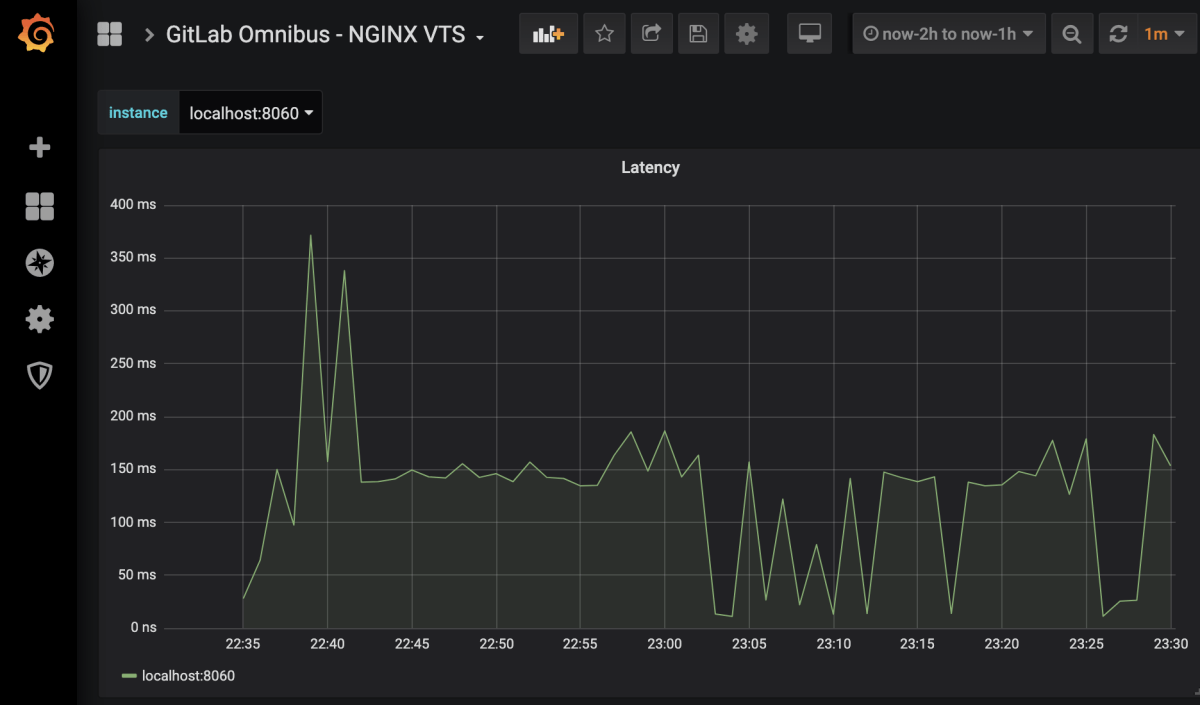
It is possible to embed live Grafana charts in issues, as a direct linked rendered image.
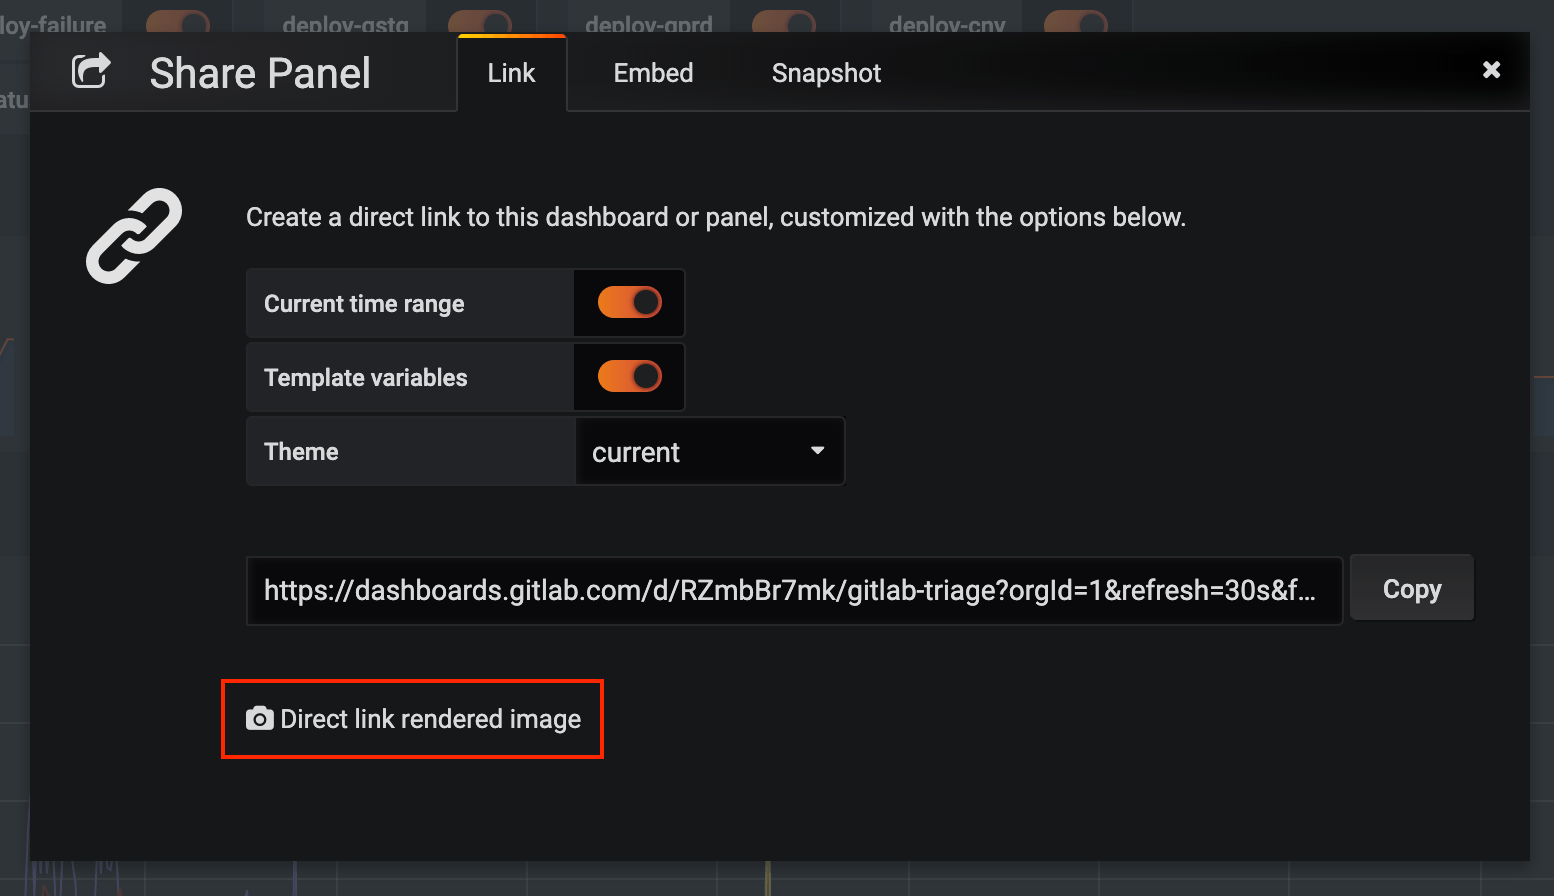
The sharing dialog within Grafana provides the link, as highlighted below.
NOTE: Note: For this embed to display correctly, the Grafana instance must be available to the target user, either as a public dashboard, or on the same network.
Copy the link and add an image tag as inline HTML in your Markdown. You may tweak the query parameters as required. For instance, removing the &from= and &to= parameters will give you a live chart. Here is example markup for a live chart from GitLab's public dashboard:
<img src="https://dashboards.gitlab.com/d/RZmbBr7mk/gitlab-triage?orgId=1&refresh=30s&var-env=gprd&var-environment=gprd&var-prometheus=prometheus-01-inf-gprd&var-prometheus_app=prometheus-app-01-inf-gprd&var-backend=All&var-type=All&var-stage=main&from=1580444107655&to=1580465707655"/>
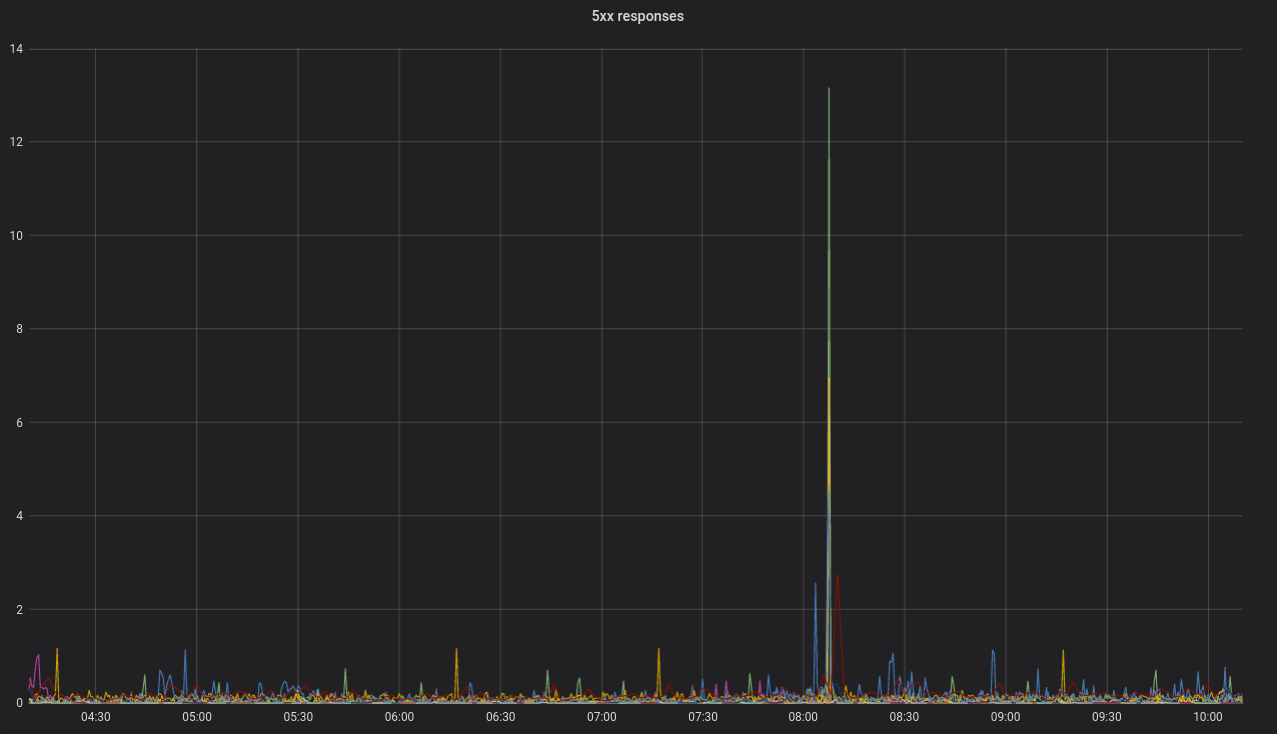
This will render like so:
Embedding charts via integration with Grafana HTTP API
Introduced in GitLab 12.5.
Each project can support integration with one Grafana instance. This configuration allows a user to copy a link to a panel in Grafana, then paste it into a GitLab Markdown field. The chart will be rendered in the GitLab chart format.
Prerequisites for embedding from a Grafana instance:
- The datasource must be a Prometheus instance.
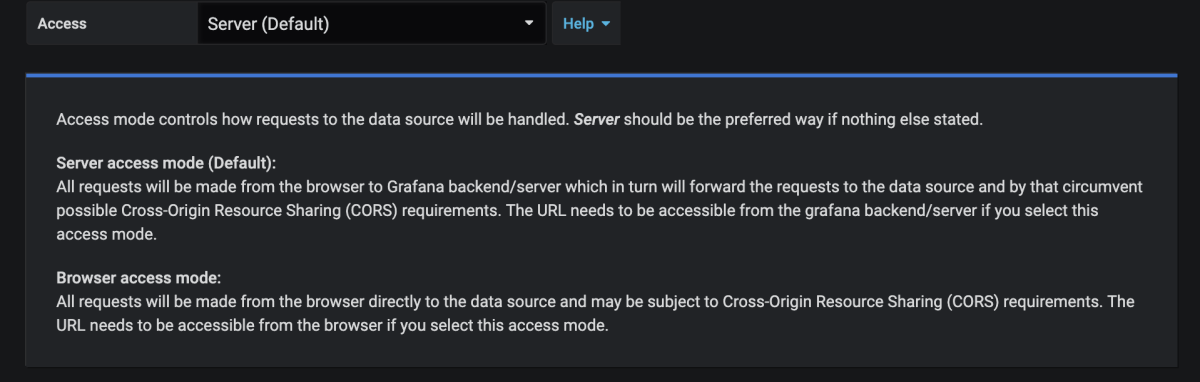
- The datasource must be proxyable, so the HTTP Access setting should be set to
Server.
Setting up the Grafana integration
- Generate an Admin-level API Token in Grafana.
- In your GitLab project, navigate to Settings > Operations > Grafana Authentication.
- To enable the integration, check the "Active" checkbox.
- For "Grafana URL", enter the base URL of the Grafana instance.
- For "API Token", enter the Admin API Token you just generated.
- Click Save Changes.
Generating a link to a chart
- In Grafana, navigate to the dashboard you wish to embed a panel from.
- In the upper-left corner of the page, select a specific value for each variable required for the queries in the chart.
- In Grafana, click on a panel's title, then click Share to open the panel's sharing dialog to the Link tab. If you click the dashboard's share panel instead, GitLab will attempt to embed the first supported panel on the dashboard (if available).
- If your Prometheus queries use Grafana's custom template variables, ensure that the "Template variables" option is toggled to On. Of Grafana global template variables, only
$__interval,$__from, and$__toare currently supported. Toggle On the "Current time range" option to specify the time range of the chart. Otherwise, the default range will be the last 8 hours.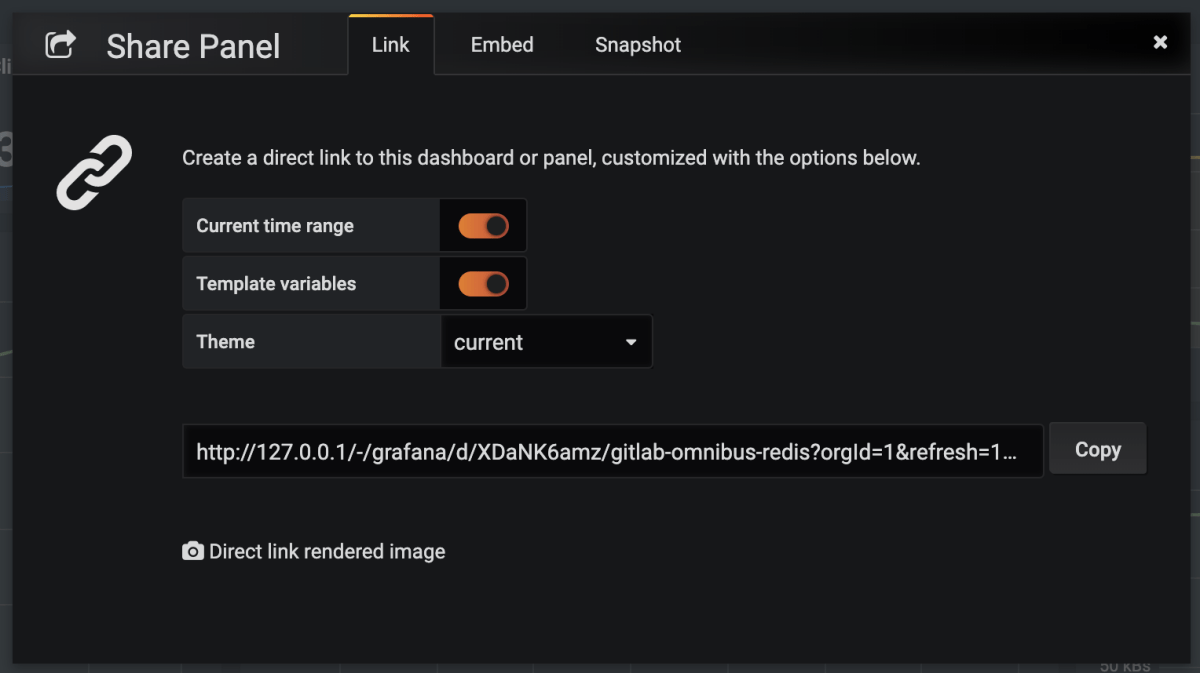
- Click Copy to copy the URL to the clipboard.
- In GitLab, paste the URL into a Markdown field and save. The chart will take a few moments to render.