5.2 KiB
| stage | group | info |
|---|---|---|
| Release | Release | To determine the technical writer assigned to the Stage/Group associated with this page, see https://about.gitlab.com/handbook/engineering/ux/technical-writing/#assignments |
CI/CD analytics (FREE)
Pipeline success and duration charts
Renamed to CI/CD Analytics in GitLab 12.8.
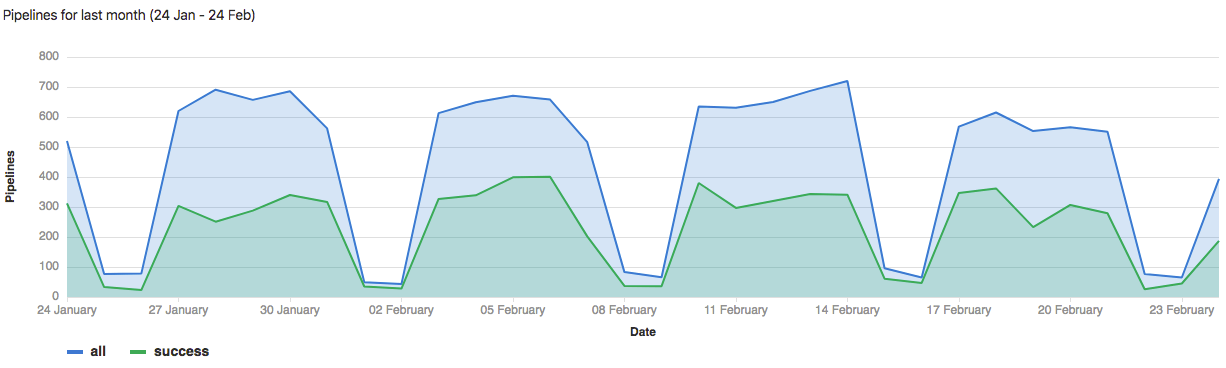
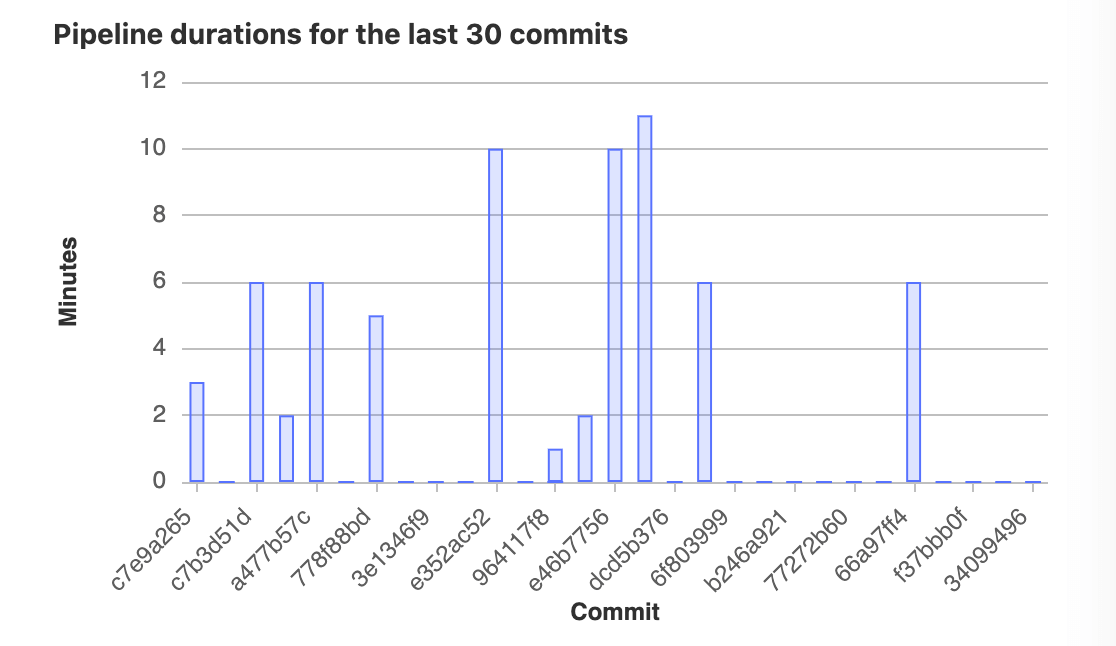
CI/CD analytics shows the history of your pipeline successes and failures, as well as how long each pipeline ran.
View successful pipelines:
View pipeline duration history:
Pipeline statistics are gathered by collecting all available pipelines for the project regardless of status. The data available for each individual day is based on when the pipeline was created. The total pipeline calculation includes child pipelines and pipelines that failed with invalid YAML. If you are interested in filtering pipelines based on other attributes, consider using the Pipelines API.
View CI/CD analytics
To view CI/CD analytics:
- On the top bar, select Menu > Projects and find your project.
- On the left sidebar, select Analytics > CI/CD Analytics.
DevOps Research and Assessment (DORA) key metrics (ULTIMATE)
- Introduced in GitLab 13.7.
- Added support for lead time for changes in GitLab 13.10.
The DevOps Research and Assessment (DORA) team developed several key metrics that you can use as performance indicators for software development teams:
- Deployment frequency: How often an organization successfully releases to production.
- Lead time for changes: The amount of time it takes for code to reach production.
- Change failure rate: The percentage of deployments that cause a failure in production.
- Time to restore service: How long it takes for an organization to recover from a failure in production.
Supported metrics in GitLab
The following table shows the supported metrics, at which level they are supported, and which GitLab version (API and UI) they were introduced:
| Metric | Level | API version | Chart (UI) version | Comments |
|---|---|---|---|---|
deployment_frequency |
Project-level | 13.7+ | 13.8+ | The old API endpoint was deprecated in 13.10. |
deployment_frequency |
Group-level | 13.10+ | 13.12+ | |
lead_time_for_changes |
Project-level | 13.10+ | 13.11+ | Unit in seconds. Aggregation method is median. |
lead_time_for_changes |
Group-level | 13.10+ | 14.0+ | Unit in seconds. Aggregation method is median. |
change_failure_rate |
Project/Group-level | To be supported | To be supported | |
time_to_restore_service |
Project/Group-level | To be supported | To be supported |
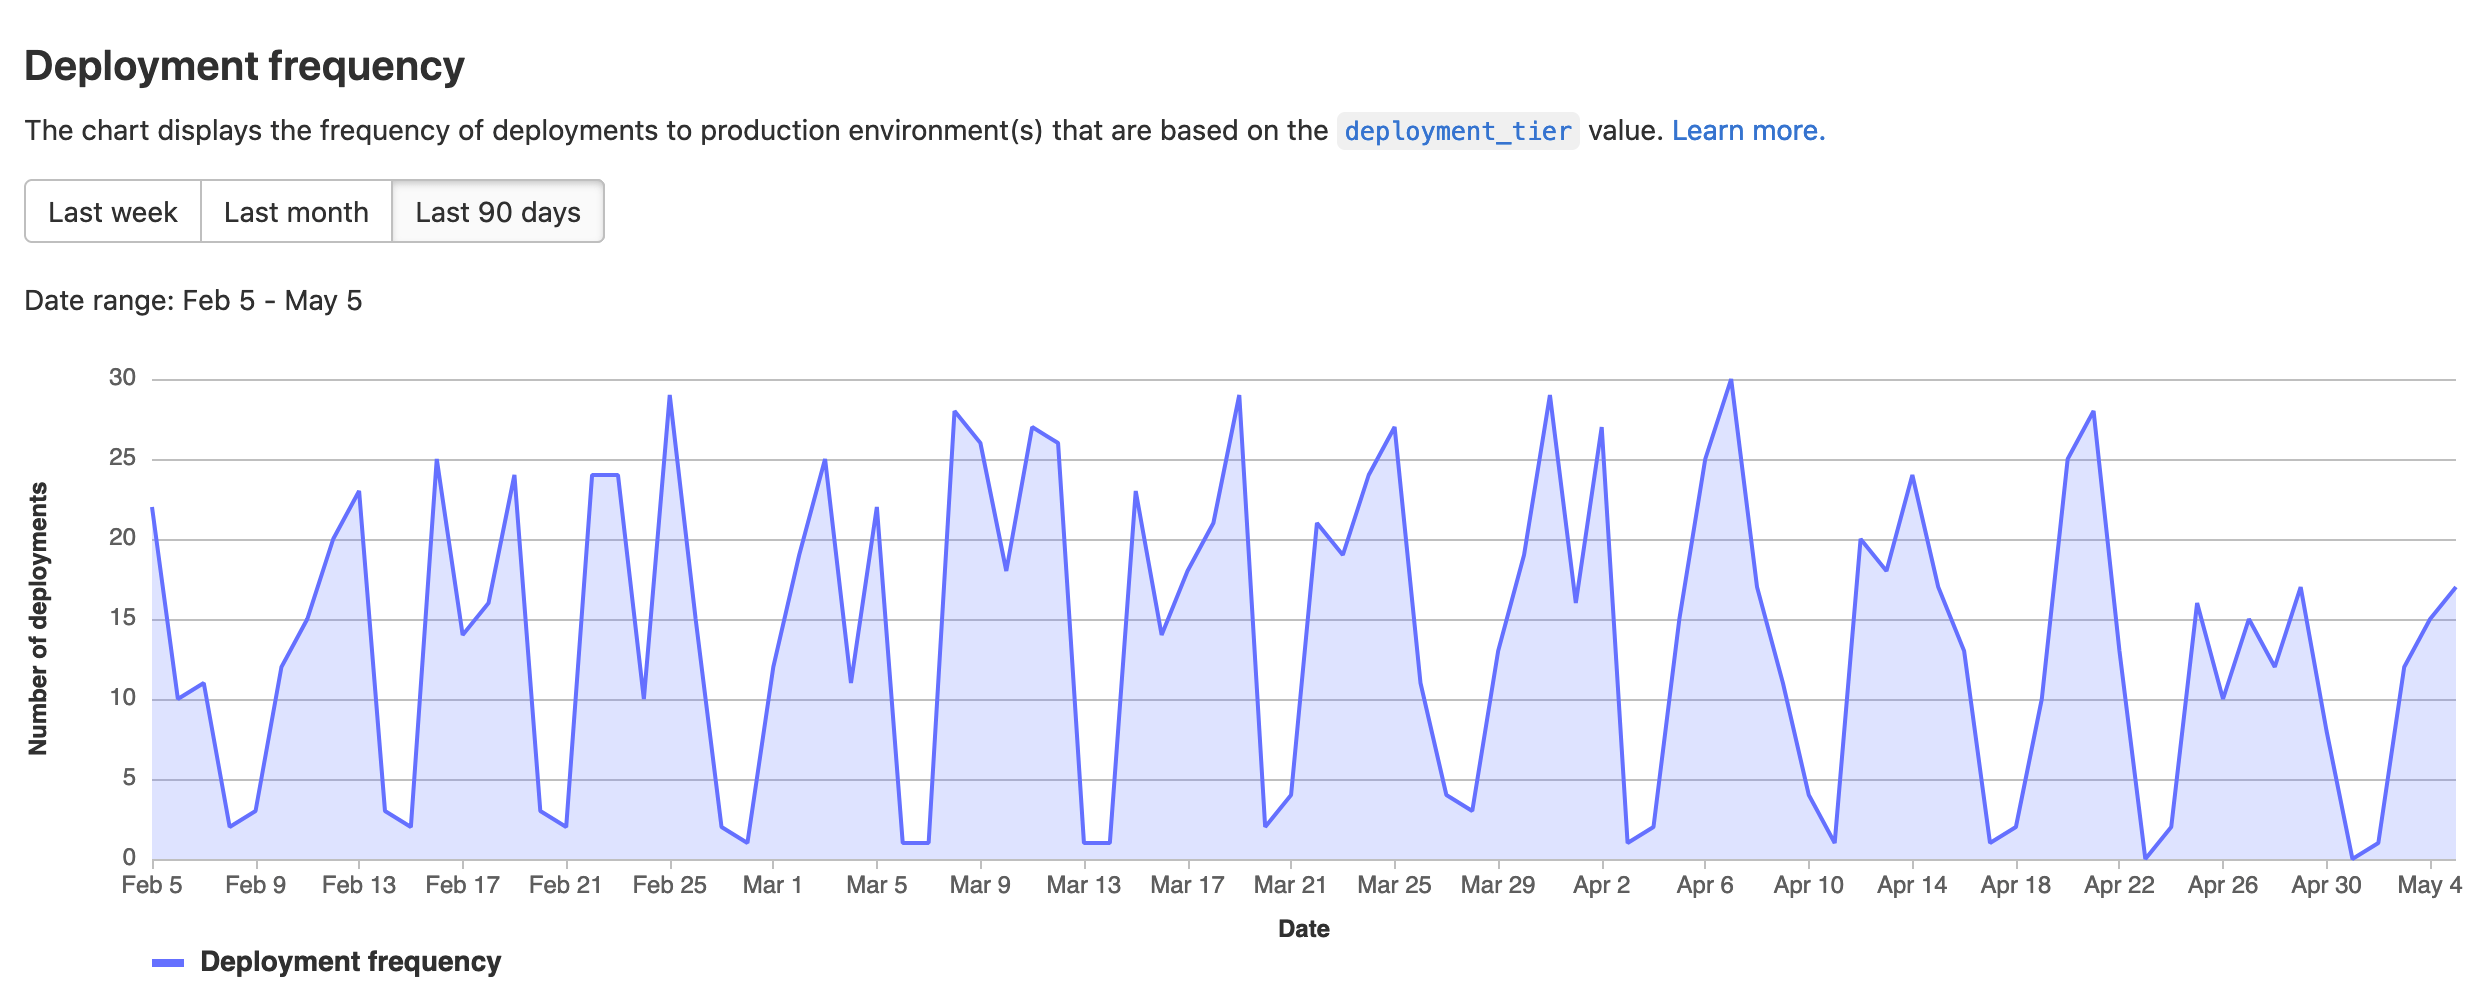
View deployment frequency chart (ULTIMATE)
Introduced in GitLab 13.8.
The deployment frequency charts show information about the deployment
frequency to the production environment. The environment must be part of the
production deployment tier
for its deployment information to appear on the graphs.
The deployment frequency chart is available for groups and projects.
To view the deployment frequency chart:
- On the top bar, select Menu > Projects and find your project.
- On the left sidebar, select Analytics > CI/CD Analytics.
- Select the Deployment frequency tab.
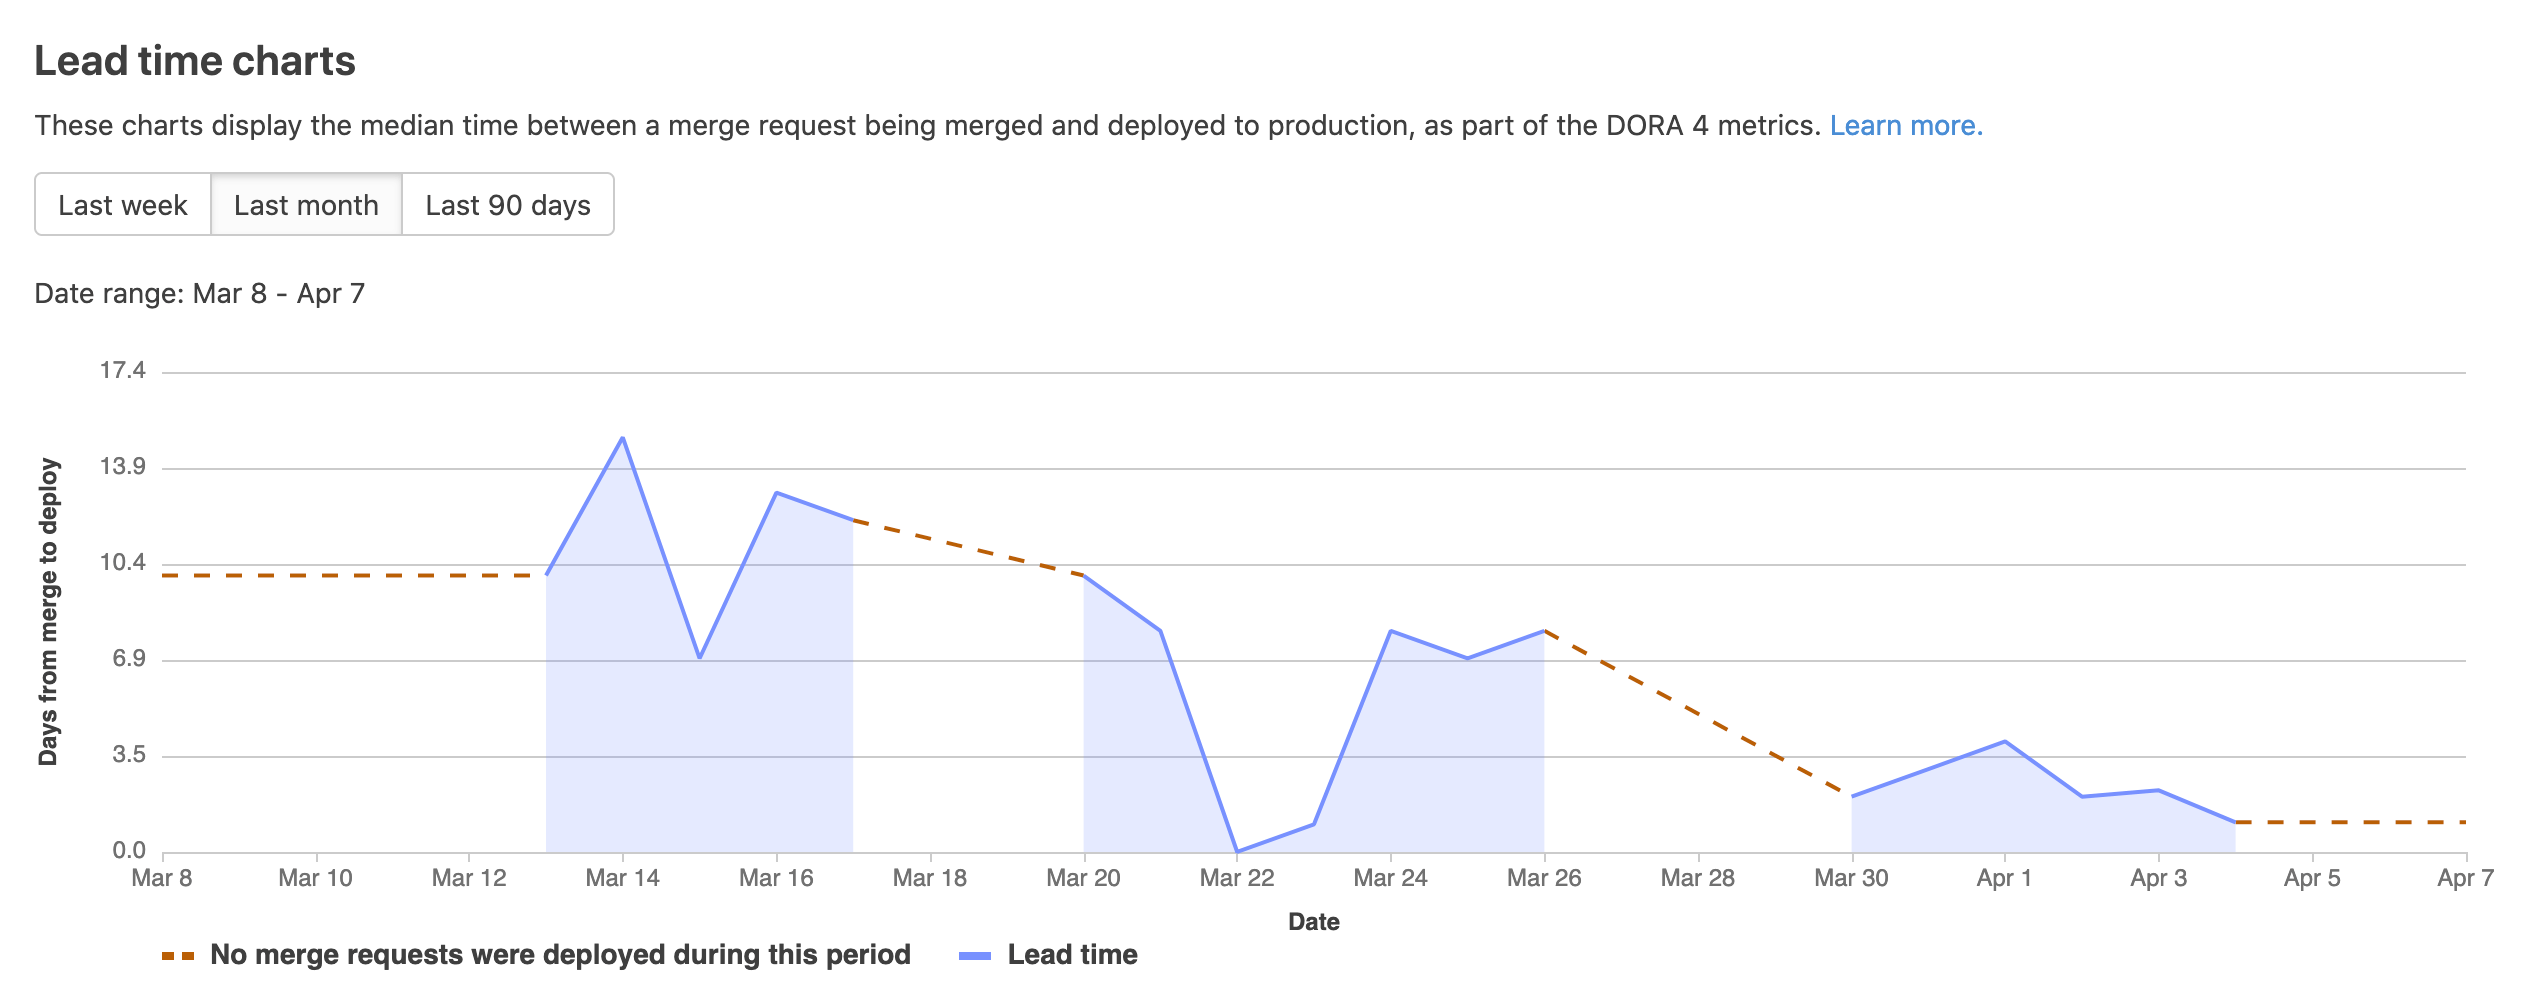
View lead time for changes chart (ULTIMATE)
Introduced in GitLab 13.11.
The lead time for changes chart shows information about how long it takes for merge requests to be deployed to a production environment. This chart is available for groups and projects.
- Small lead times indicate fast, efficient deployment processes.
- For time periods in which no merge requests were deployed, the charts render a red, dashed line.
To view the lead time for changes chart:
- On the top bar, select Menu > Projects and find your project.
- On the left sidebar, select Analytics > CI/CD Analytics.
- Select the Lead time tab.