8.2 KiB
| stage | group | info |
|---|---|---|
| Monitor | Monitor | To determine the technical writer assigned to the Stage/Group associated with this page, see https://about.gitlab.com/handbook/engineering/ux/technical-writing/#assignments |
Set up alerts for Prometheus metrics (FREE)
Moved to GitLab Free in 12.10.
After configuring metrics for your CI/CD environment, you can set up alerting for Prometheus metrics depending on the location of your instances, and trigger actions from alerts to notify your team when environment performance falls outside of the boundaries you set.
Managed Prometheus instances
Introduced in GitLab Ultimate 11.2 for custom metrics, and GitLab 11.3 for library metrics.
WARNING: Managed Prometheus on Kubernetes is deprecated and scheduled for removal in GitLab 14.0.
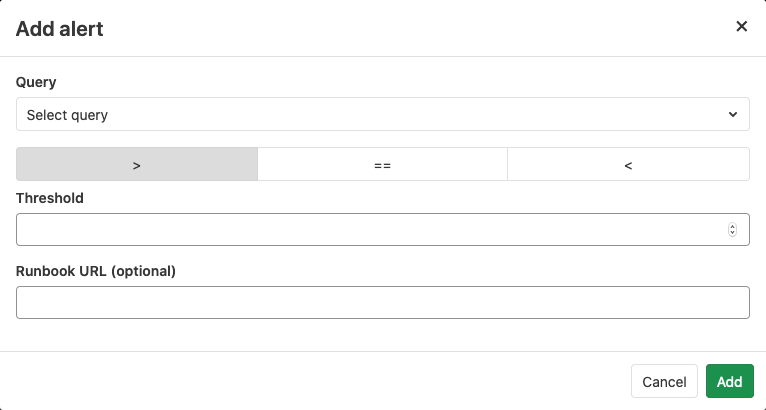
For managed Prometheus instances using auto configuration, you can configure alerts for metrics directly in the metrics dashboard. To set an alert:
- In your project, navigate to Monitor > Metrics,
- Identify the metric you want to create the alert for, and click the ellipsis {ellipsis_v} icon in the top right corner of the metric.
- Choose Alerts.
- Set threshold and operator.
- (Optional) Add a Runbook URL.
- Click Add to save and activate the alert.
To remove the alert, click back on the alert icon for the desired metric, and click Delete.
Link runbooks to alerts
- Introduced in GitLab 13.3.
- Deprecated in GitLab 13.11.
- Removed in GitLab 14.0.
WARNING: Linking runbooks to alerts through the alerts UI is deprecated and scheduled for removal in GitLab 14.0. However, you can still add runbooks to your alert payload. They show up in the alert UI when the alert is triggered.
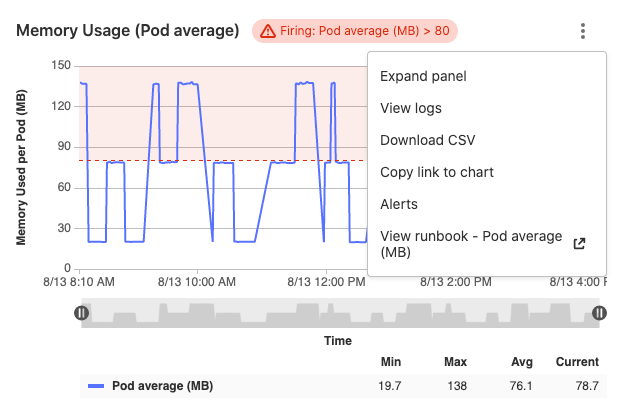
When creating alerts from the metrics dashboard for managed Prometheus instances, you can also link a runbook. When the alert triggers, the chart context menu on the metrics chart links to the runbook, making it easy for you to locate and access the correct runbook as soon as the alert fires:
Prometheus cluster integrations
Alerts are not currently supported for Prometheus cluster integrations.
External Prometheus instances
- Introduced in GitLab Ultimate 11.8.
- Moved to GitLab Free in 12.10.
For manually configured Prometheus servers, GitLab provides a notify endpoint for use with Prometheus webhooks. If you have manual configuration enabled, an Alerts section is added to Settings > Integrations > Prometheus. This section contains the needed URL and Authorization Key. The Reset Key button invalidates the key and generates a new one.
To send GitLab alert notifications, copy the URL and Authorization Key into the
webhook_configs
section of your Prometheus Alertmanager configuration:
receivers:
  - name: gitlab
    webhook_configs:
      - http_config:
          authorization:
            type: Bearer
            credentials: 9e1cbfcd546896a9ea8be557caf13a76
        send_resolved: true
        url: http://192.168.178.31:3001/root/manual_prometheus/prometheus/alerts/notify.json
        # Rest of configuration omitted
        # ...
For GitLab to associate your alerts with an environment,
you must configure a gitlab_environment_name label on the alerts you set up in
Prometheus. The value of this should match the name of your environment in GitLab.
You can display alerts with a gitlab_environment_name of production
on a dashboard.
In GitLab versions 13.1 and greater, you can configure your manually configured Prometheus server to use the Generic alerts integration.
Trigger actions from alerts (ULTIMATE)
- Introduced in GitLab Ultimate 11.11.
Alerts can be used to trigger actions, like opening an issue automatically
(disabled by default since 13.1). To configure the actions:
- Navigate to your project's Settings > Monitor > Alerts.
- Enable the option to create issues.
- Choose the issue template to create the issue from.
- Optionally, select whether to send an email notification to the developers of the project.
- Click Save changes.
After enabling, GitLab automatically opens an issue when an alert is triggered containing
values extracted from the alerts field in webhook payload:
- Issue author:
GitLab Alert Bot - Issue title: Extracted from the alert payload fields
annotations/title,annotations/summary, orlabels/alertname. - Issue description: Extracted from alert payload field
annotations/description. - Alert
Summary: A list of properties from the alert's payload.starts_at: Alert start time from the payload'sstartsAtfieldfull_query: Alert query extracted from the payload'sgeneratorURLfield- Optional list of attached annotations extracted from
annotations/*
- Alert GFM: GitLab Flavored Markdown from the payload's
annotations/gitlab_incident_markdownfield. - Alert Severity (introduced in GitLab version 13.9:
Extracted from the alert payload field
labels/severity. Maps case-insensitive value to Alert's severity:- Critical:
critical,s1,p1,emergency,fatal, or any value not in this list - High:
high,s2,p2,major,page - Medium:
medium,s3,p3,error,alert - Low:
low,s4,p4,warn,warning - Info:
info,s5,p5,debug,information,notice
- Critical:
To further customize the issue, you can add labels, mentions, or any other supported
quick action in the selected issue template,
which applies to all incidents. To limit quick actions or other information to
only specific types of alerts, use the annotations/gitlab_incident_markdown field.
Since version 12.2,
GitLab tags each incident issue with the incident label automatically. If the label
does not yet exist, it is also created automatically.
If the metric exceeds the threshold of the alert for over 5 minutes, GitLab sends an email to all Maintainers and Owners of the project.
Recovery alerts
- From GitLab Ultimate 12.5, when GitLab receives a recovery alert, it automatically closes the associated issue.
The alert in GitLab will be automatically resolved when Prometheus
sends a payload with the field status set to resolved.
You can also configure the associated incident to be closed automatically when the alert resolves.


