| .. | ||
| v1 | ||
| v2 | ||
| README.md | ||
Benchmark Report
Benchmarks were run at various stages of development to keep track of performance. Tech stacks were changed and the implementation optimized to increase throughput. This report summarizes the findings of the benchmarks
Ultimately, we were able to identify a bottleneck that was previously hidden in mCaptcha (hidden because a different bottleneck like DB access eclipsed it :p) and were able to increase performance of the critical path by ~147 times through a trivial optimization.
Environment
These benchmarks were run on a noisy development laptop and should be used for guidance only.
- CPU: AMD Ryzen 5 5600U with Radeon Graphics (12) @ 4.289GHz
- Memory: 22849MiB
- OS: Arch Linux x86_64
- Kernel: 6.6.7-arch1-1
- rustc: 1.73.0 (cc66ad468 2023-10-03)
Baseline: Tech stack version 1
Actix Web based networking with JSON for message format. Was chosen for prototyping, and was later used to set a baseline.
Without connection pooling in server-to-server communications
Single requests (no batching)
Peak throughput observed was 1117 request/second (please click to see charts)
Total number of requests vs time

Response times(ms) vs time
_1703969194.png)
Number of concurrent users vs time
Batched requests
Each network request contained 1,000 application requests, so peak throughput observed was 1,800 request/second. Please click to see charts
Total number of requests vs time
Response times(ms) vs time
_1703968582.png) )
)
Number of concurrent users vs time
With connection pooling in server-to-server communications
Single requests (no batching)
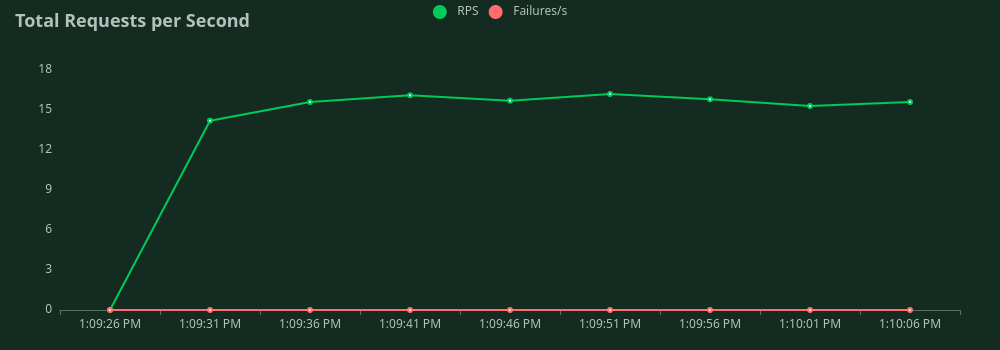
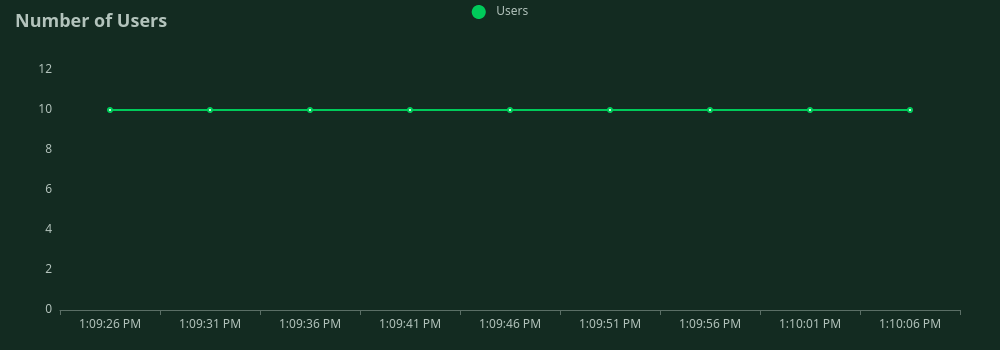
Peak throughput observed was 3904 request/second. Please click to see charts
Total number of requests vs time

Response times(ms) vs time
_1703968215.png)
Number of concurrent users vs time

Batched requests
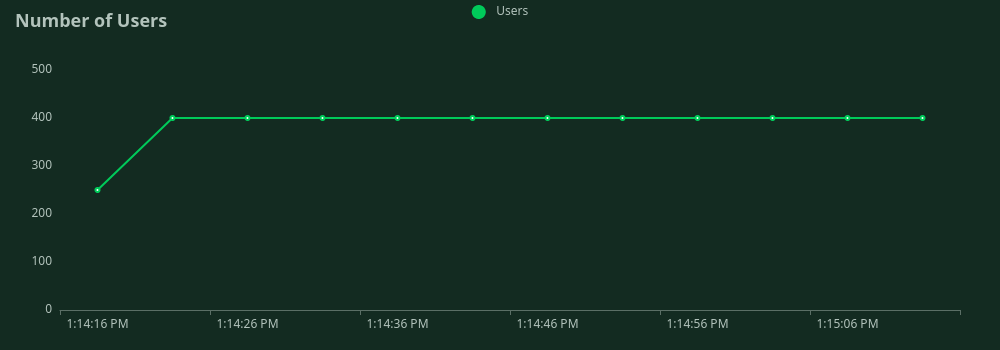
Each network request contained 1,000 application requests, so peak throughput observed was 15,800 request/second. Please click to see charts.
Total number of requests vs time
Response times(ms) vs time
)
Number of concurrent users vs time
Tech stack version 2
Tonic for the network stack and GRPC for wire format. We ran over a dozen benchmarks with this tech stack. The trend was similar to the ones observed above: throughput was higher when connection pool was used and even higher when requests were batched. But the throughput of all of these benchmarks were lower than the baseline benchmarks!
The CPU was busier. We put it through flamgragh and hit it with the same test suite to identify compute-heavy areas. The result was unexpected:

libmCaptcha's AddVisitor handler was taking up 59% of CPU time of the entire test run. This is a very critical part of the variable difficulty factor PoW algorithm that mCaptcha uses. We never ran into this bottleneck before because in other cache implementations, it was always preceded with a database request. It surfaced here as we are using in-memory data sources in dcache.
libmCaptcha uses an actor-based approach with message passing for clean concurrent state management. Message passing is generally faster in most cases, but in our case, sharing memory using CPU's concurrent primitives turned out to be significantly faster:

CPU time was reduced from 59% to 0.4%, roughly by one 147 times!
With this fix in place:
Connection pooled server-to-server communications, single requests (no batching)
Peak throughput observed was 4816 request/second, ~1000 requests/second more than baseline.
Total number of requests vs time
Response times(ms) vs time
_1703970940.png)
Number of concurrent users vs time
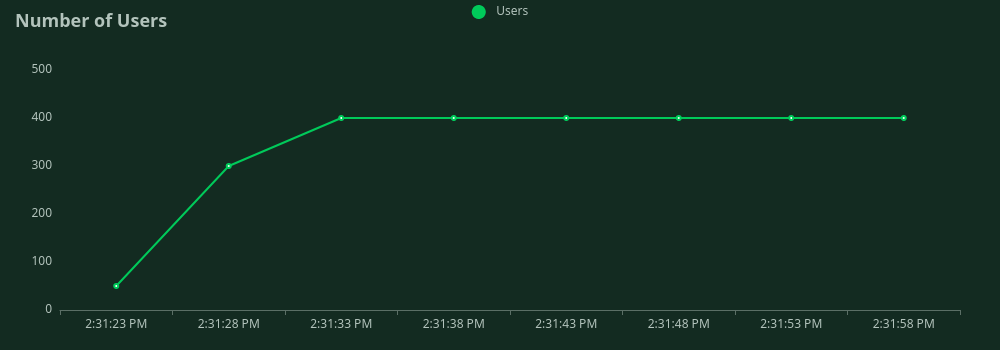
Connection pooled server-to-server communications, batched requests
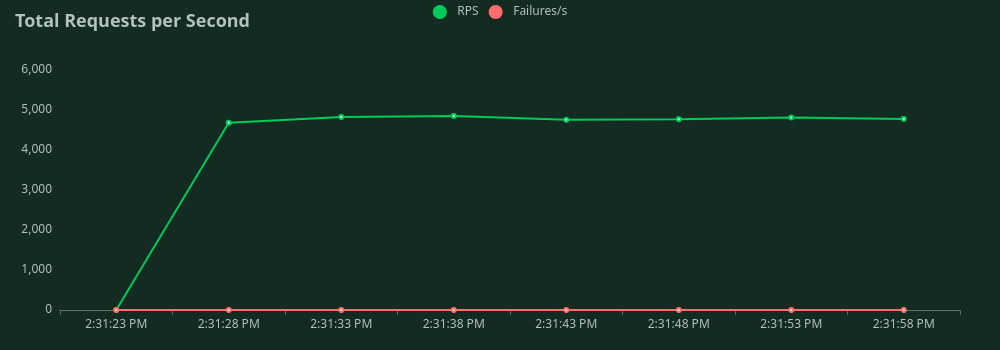
Each network request contained 1,000 application requests, so peak throughput observed was 95,700 request/second. This six times higher than baseline. Please click to see charts.
Total number of requests vs time

Response times(ms) vs time
_1703971082.png)
Number of concurrent users vs time
